.avif)
Qualitative and quantitative analysis: Which should you choose?
Quantity or quality? Use these two analyses to improve UX and boost your CRO strategy!
.webp)
For any business, quantitative and qualitative data are crucial sources for gaining a deeper understanding of its customer base and thereby improving the product experience to maximize performance. With this in mind, experimentation leverages both types of data to launch a CRO initiative with two distinct research phases: quantitative analysis and qualitative analysis. Let’s take a look at how they differ and how to best utilize them in your data-driven marketing strategies.
What is quantitative and qualitative analysis?
Definition of quantitative analysis
Quantitative research, also known as quantitative analysis, is a method that relies on facts and numerical data—often presented as statistics—to understand and analyze human behavior. These results are analyzed in a table or graph following data collection.
As part of our CRO strategy, we leverage our clients’ first-party data from analytics tools such as Google Analytics 4 and Piano Analytics.
Example of quantitative analysis in CRO:
When analyzing the sales funnel in Google Analytics 4, we identified a specific issue: 70% of users abandon their carts at step 3.
- The bottom line: We know where users are going and how many there are.
- The catch: We don't yet know why they're leaving (is it the price? A glitch? A form that's too long?).
Definition of qualitative analysis
Qualitative research is based on the interpretation of behavioral data. It is used to understand or explain an observed phenomenon.
This descriptive method draws on studies such as user interviews or observations like heatmaps and session replays, which can be obtained from tools like Contentsquare or Air360.
Example of qualitative analysis in CRO:
To understand the abandoned cart identified earlier, we use Contentsquare to view the session replays for the checkout stage.
- Observation: We’ve noticed that users click the “Submit” button several times, but the page doesn’t load: a required field isn’t clearly marked.
- The insight: Qualitative analysis reveals the root cause of the problem (an interface/UX flaw) that the numbers alone could not explain.
What are the differences between quantitative and qualitative analysis?
To optimize the user experience, it is crucial not to pit these two methods against each other, but to view them as two sides of the same coin. Here is a comparison chart to help clarify things:
These two distinct approaches offer a real opportunity when combined within a mixed-methods approach.
Why combine quantitative and qualitative research?
Relying solely on a single research method does not provide a complete answer to the question, as it lacks context.
In fact, relying solely on quantitative or qualitative analysis is risky in itself because:
- Quantitative analysis alone: numerical results will not answer the questions “Why?” or “How?”—in other words, they will not help us understand the reasons behind them.
- Qualitative analysis alone: the observations cannot be accurately assessed. Furthermore, without quantitative data, qualitative analysis may lack direction.
Thus, adding a new layer of data to the analysis provides a broader perspective, making it easier to understand the data and draw solid insights. Combining the two methods helps to address the shortcomings of each individual approach.
3 examples of mixed methods
In UX research, there are several mixed-methods approaches, as outlined by Creswell and Plano in their book*Designing and Conducting Mixed Methods Research*, each suited to a specific use case.
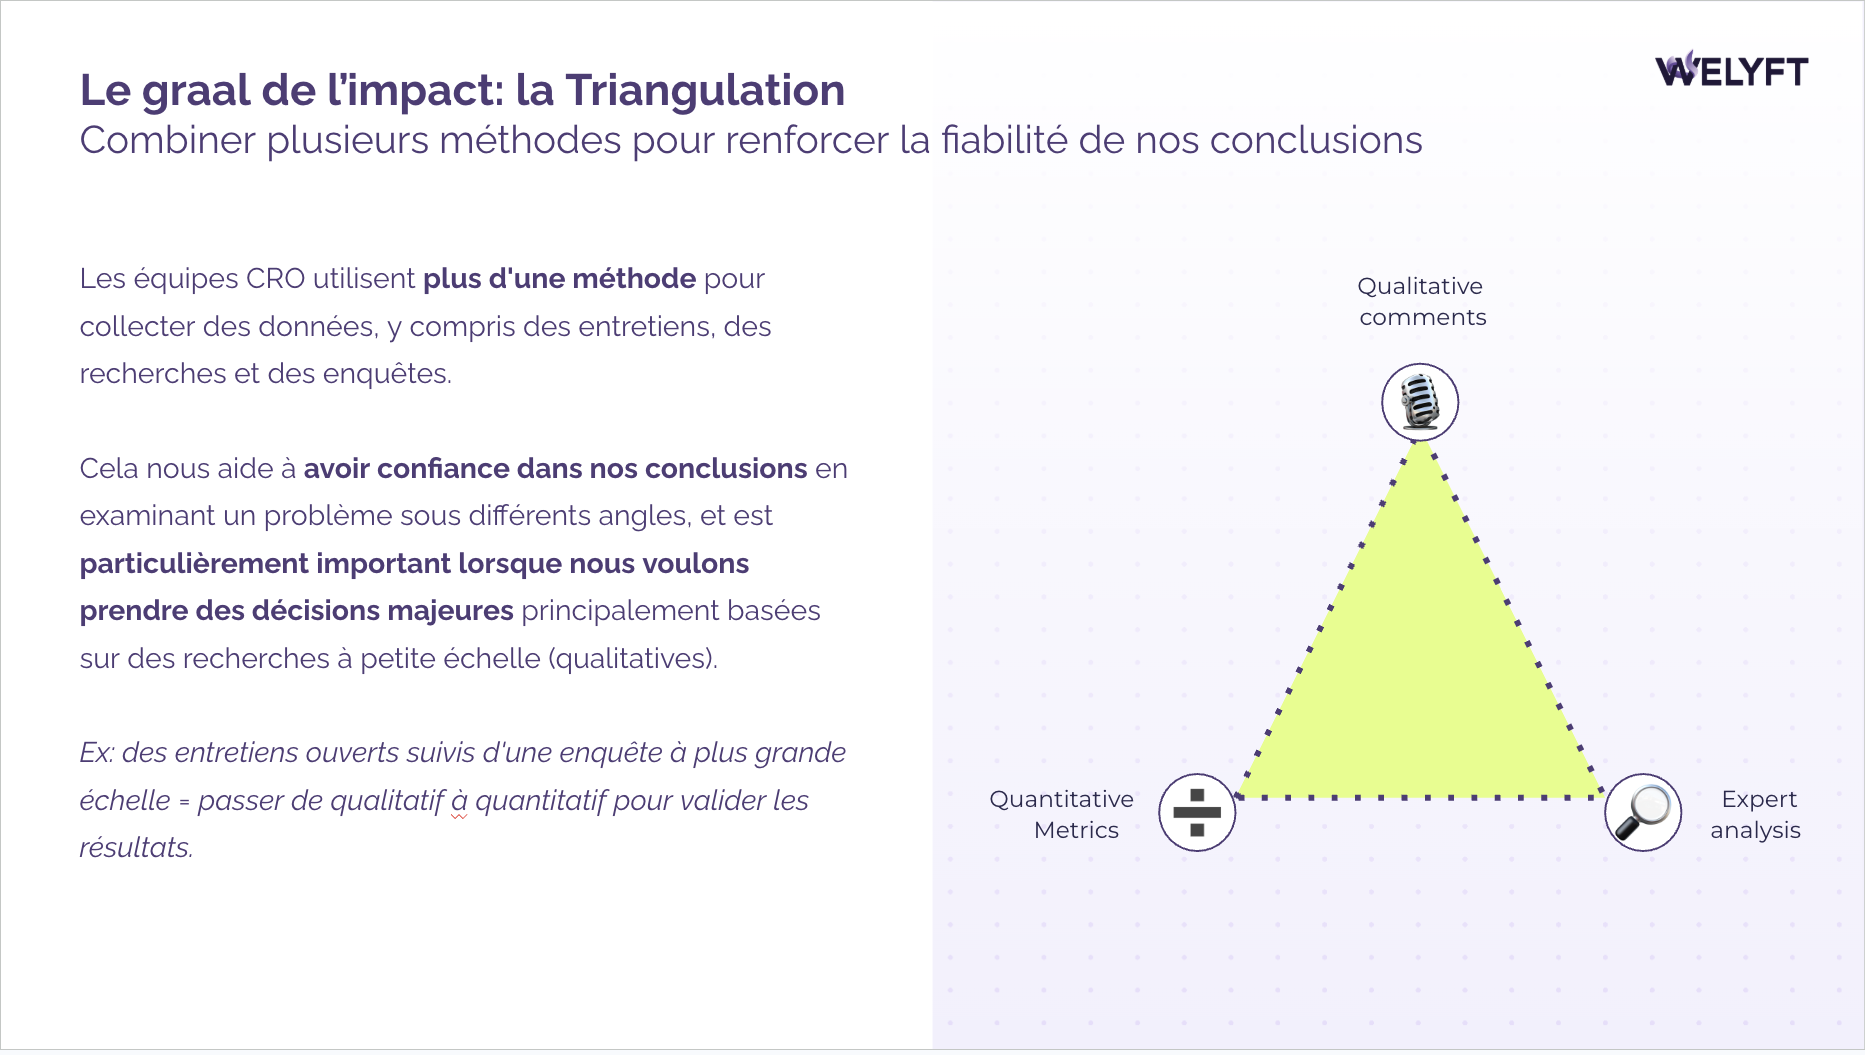
Triangulation
At Welyft, we use triangulation to transform raw data into a 360° view of your users. More than just a verification tool, it’s a way to uncover deep insights.
The strength of this method lies in the variety of perspectives it offers:
- Quantitative insights: Through data analysis, we identify mass behaviors and statistical pain points.
- Qualitative insights: by analyzing recorded sessions, interviews, and user tests, we gain an understanding of users’ emotions, underlying motivations, and frustrations.
- Contextual insight: by observing users in their real-world environment, we pick up on subtle cues and unspoken behaviors.
The rigor of triangulation must always be proportional to the business risk involved in the optimization. For a minor change, a limited set of indicators is sufficient to validate the intuition. However, as soon as the issue impacts the core of the user experience or the business model, we expand the range of data sources. The goal is to tailor the research effort to ensure confident decision-making without sacrificing the speed required for the project.
The exploratory model
This model consists of two successive stages.
It begins with a qualitative exploratory phase aimed at identifying hypotheses, pain points, or user needs that are not yet well understood, through interviews, user tests, or the analysis of user feedback.
These initial findings then serve as the basis for a quantitative phase designed to measure the scale of the observed phenomena and prioritize opportunities for scaling up.
This model is particularly useful when the problem is poorly defined or when entering a new product or functional scope.
The explanatory model
As with the exploratory model, the explanatory model consists of two stages, but unlike the exploratory model, it begins with a quantitative analysis.
Qualitative analysis then begins to explain the observed phenomena.
What if data alone isn't enough to make a decision?
Where is the line between qualitative and quantitative analysis?
In the field of UX research, the line between these two approaches is often blurred. This is where we get the most out of each type of data. Here are four concrete examples where quantitative and qualitative approaches come together to provide a comprehensive analysis:
By staying within these boundaries, you’re no longer just measuring behavior—you’re beginning to humanize it in order to make fairer decisions.
Which analysis method should you choose for CRO?
In reality, pitting quantity against quality is a false dichotomy. To maximize the performance of a digital product, the question isn't which one to choose, but how to make them work together.
At Welyft, we don’t just collect statistics or list user frustrations. As part of our CRO audits, we systematically apply data triangulation:
- Using quantitative data: we pinpoint exactly where bottlenecks occur in the funnel.
- Using qualitative analysis: we examine the motivations and psychological barriers underlying these behaviors.
This broader perspective makes it possible to prioritize the true drivers of conversion, avoid decisions based on isolated data points, and formulate hypotheses that are actionable, measurable, and robust.
The result for our clients? Recommendations that are no longer gambles but investments. By making experiments more relevant, we transform the CRO approach into a predictable and sustainable driver of growth.


.png)

.png)
.png)


.png)
.png)
.png)
