


Growth Manager, CRO or Product Owner, you know this moment: plenty of ideas but no roadmap, a backlog of 40 test ideas, an overflowing Jira board, and a single question blocking everything: "Where do we start?"
With limited time and developers available, every test launched deprives another test of its chance. The problem is that without a shared framework, this decision often relies on intuition, the urgency of the moment, or the opinion of the most convincing person in the meeting. The result: valuable resources invested in low-potential optimizations, while the real growth levers wait at the bottom of the pile.
At Welyft, as a CRO agency, prioritization is the first workstream we open with our clients. And for several years now, our experimentation roadmap has relied on a precise framework: RICES (Reach, Impact, Confidence, Effort, Strategy). In this article, we explain how we use it in practice, how to score your own ideas, and why it's not just a formula but a true CRO governance tool.
Why aren't all optimizations equal?
A CRO roadmap is never limited by a lack of ideas. It's limited by time, development capacity and team attention. Every test costs resources, whether it's design time, development, QA, or simply the traffic mobilized during the test's duration.
Yet, without a prioritization method, two biases consistently appear in the organizations we support:
- HiPPO bias (Highest Paid Person's Opinion): decisions are made based on the opinion of the most senior person in the room, not on the idea's actual potential.
- Ease bias: teams tackle the simplest tests to develop rather than the most profitable ones, out of comfort or a desire to "show velocity".
The framework serves precisely as a safeguard against these two pitfalls. By assigning an objective, shared score to each idea, it turns a debate of opinions into a discussion based on common criteria. It's no longer "I think this test is a priority" but "this test scores 6.4, that one 4.4, here's why".
It's this shift, from intuition to scoring, that makes it possible to build a tailored CRO program and turn prioritization into a genuine driver of organizational value, not just a backlog-sorting exercise.
The 5 criteria of the method
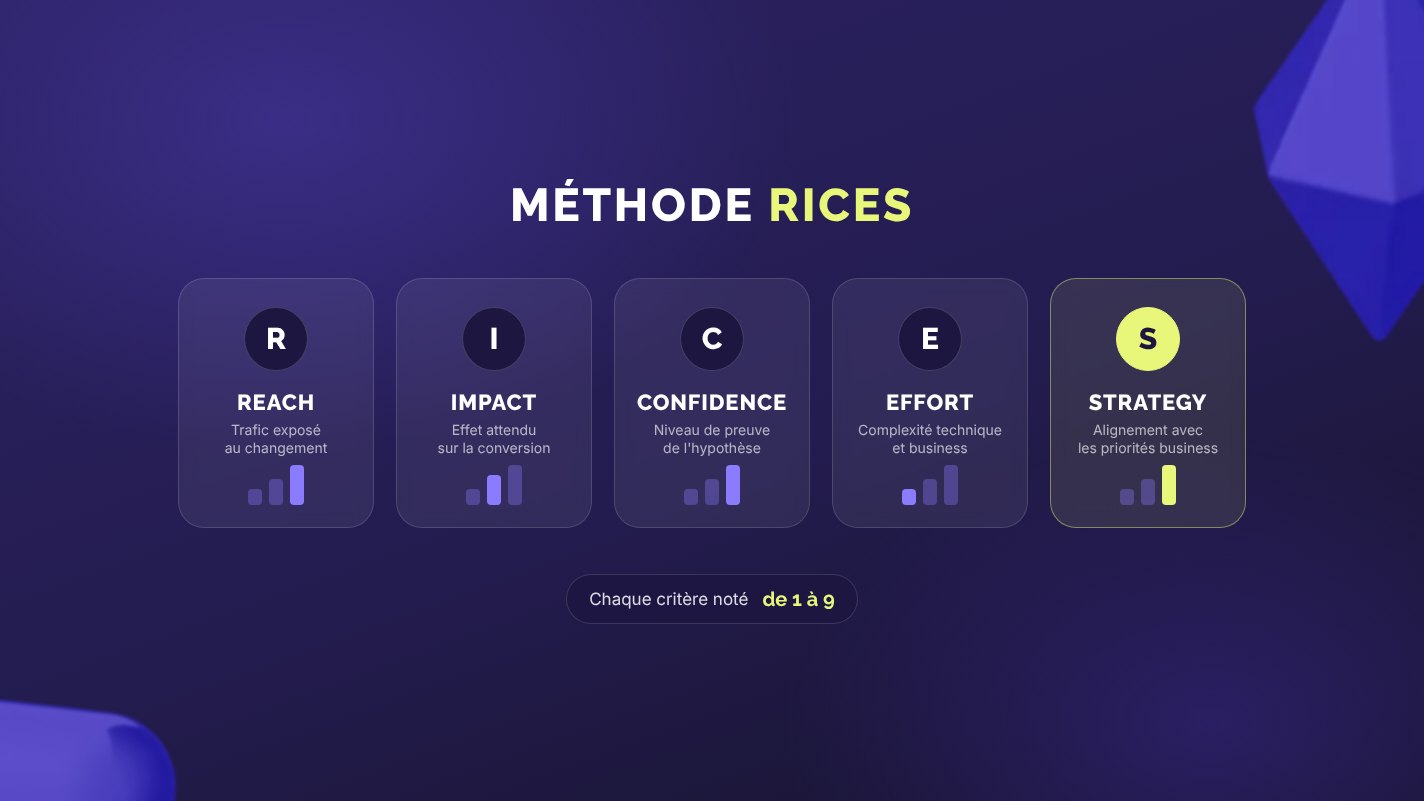
RICES draws on the RICE framework popularized by growth teams, to which we at Welyft have added a fifth pillar: Strategy. Why? Because a test can be profitable in the short term without serving the business priorities of the moment. This fifth criterion keeps the roadmap aligned with the company's vision, not just with immediate performance.
Here's how we break down each of the 5 criteria.
Reach: the visibility of the change
Reach measures the volume of users exposed to the tested change over a given period (usually a month). A test on a product page, seen by 100% of traffic, will have a much higher Reach than a test on an account page, visited by a minority of logged-in users.
- Question to ask: how many users will actually see this variation?
- Scale used at Welyft: from 1 (niche audience) to 9 (nearly all traffic).
Impact: the expected effect on the user experience
Impact assesses the magnitude of the expected effect on the behaviour of the exposed user, and therefore on conversion. A change that removes a major friction identified in user research will have a high Impact. A cosmetic adjustment will have a lower Impact, even if it affects a lot of people.
- Question to ask: if this change works, how significant will the gain be on the targeted KPI?
- Scale used at Welyft: from 1 (marginal effect) to 9 (major conversion lever).
Confidence: the level of evidence behind the hypothesis
Confidence weights the two previous criteria according to the solidity of the data supporting the hypothesis. A test based on a triangulation of insights (quantitative data, verbatims, session replays) deserves a high Confidence score. A test based on a simple intuition, even a brilliant one, should be weighted down.
- Question to ask: what is this hypothesis based on? Solid data, or a hunch?
- Scale used at Welyft: from 1 (intuition or industry benchmark) to 9 (multiple, converging evidence).
Effort: the duality between technical and business complexity
Effort also factors into the score: the greater the effort, the lower its score, and the more it weighs on the final result. This is where the method really makes sense, because Effort isn't limited to development workload. It combines two dimensions:
- Technical complexity: number of components to modify, dependencies with other teams, infrastructure constraints.
- Business complexity: legal validation, impact on other channels, need to align several stakeholders before launching.
- Question to ask: how much time and resources (dev, design, validation) are actually needed to deliver this test?
- Scale used at Welyft: from 1 (multi-week, cross-disciplinary project) to 9 (quickwin, a few hours of development).
Concrete example: a "shareable wishlist" feature idea present on all product pages can show a strong Reach of 9, since it's visible to almost all traffic. But if its implementation requires a new database schema, a notification system, and a redesign of several components, its Effort will be 1 out of 9. This technical complexity directly eats into the final score, despite a very high visibility potential.
Strategy: alignment with company priorities
This is the pillar we added to the classic RICE. Strategy measures whether the test serves a current strategic priority: launch of a new offer, a quarterly goal set by management, a priority market internationally, etc. A test that's perfectly profitable on paper, but disconnected from business priorities, should remain visible in the backlog without necessarily moving to the top of the roadmap.
- Question to ask: does this test serve a strategic objective identified by the organisation this year?
- Scale used at Welyft: from 1 (not a strategic focus) to 9 (aligned with a critical strategic priority).
How to calculate the score?
Once the 5 criteria are scored, the calculation is simple: you average the five scores.
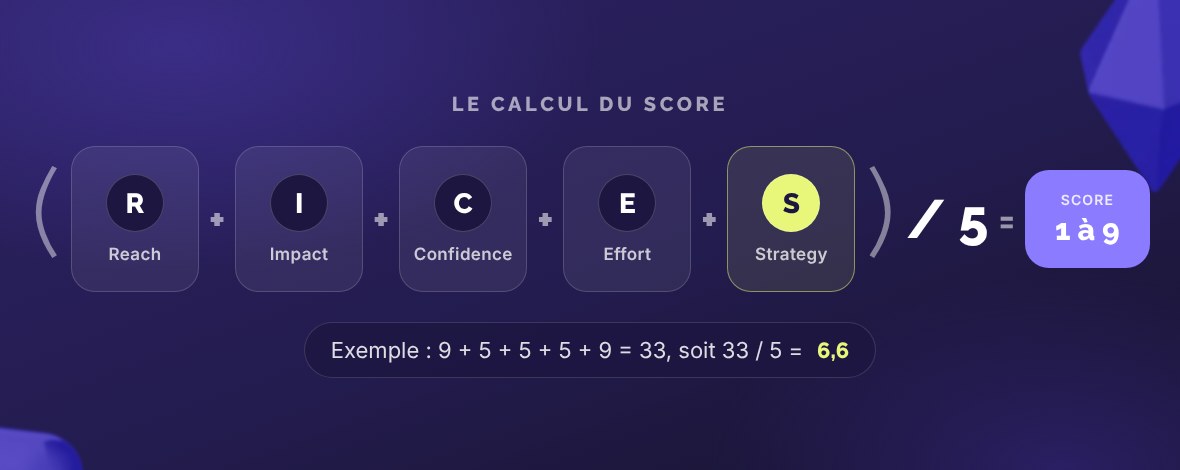
The rule is clear: the higher the score, the higher the priority of the test. Averaging all criteria ensures that no single criterion can, on its own, save an idea that's weak on the other dimensions. Exceptional Reach doesn't compensate for low Confidence. Minimal Effort doesn't make up for insignificant Impact.
Let's take a complete example. A test idea gets the following scores: Reach = 9, Impact = 5, Confidence = 5, Effort = 5, Strategy = 9.
- 9 (Reach) + 5 (Impact) + 5 (Confidence) + 5 (Effort) + 9 (Strategy) = 33
- 33 / 5 = 6.6
This test therefore gets a score of 6.6. On its own, this number means nothing. It's by comparing it to the scores of other ideas in the backlog that it takes on its full meaning and allows the roadmap order to be decided objectively.
Scoring example at Welyft
Here's how we apply this formula to a typical e-commerce test backlog. The real value of the table lies precisely in revealing surprises: "obvious" ideas in meetings sometimes end up at the bottom of the ranking, while discreet micro-optimizations rise to the top.
| Test idea | Reach | Impact | Confidence | Effort | Strategy | Score |
|---|---|---|---|---|---|---|
| Add a reassurance badge ("free shipping") below the cart CTA | 9 | 4 | 7 | 9 | 3 | 6.4 |
| Change the color of the main CTA button | 7 | 3 | 7 | 9 | 2 | 5.6 |
| Develop a conversational AI chatbot on product pages | 8 | 7 | 4 | 1 | 7 | 5.4 |
| Add a shareable wishlist feature on product pages | 8 | 4 | 5 | 1 | 4 | 4.4 |
This ranking clearly illustrates why the method concretely changes the order of a roadmap. The reassurance badge, a seemingly minor change, comes out on top thanks to near-zero Effort and strong Confidence (the reassurance lever is well documented in CRO). Conversely, the AI chatbot, often seen as a major strategic bet, ends up lower: the potential is there, but Confidence remains low as long as no solid data has validated the hypothesis, and Effort weighs heavily in the calculation.
This doesn't mean these ambitious tests should be abandoned. They should first be de-risked, for example through user testing or a low-cost prototype, before being developed into a full A/B test. The score then evolves naturally: once Confidence is strengthened by new insights, the test mechanically rises in the ranking.
A method in service of a mature CRO strategy
Beyond the calculation, the real value of RICES is organizational. By establishing a common language between Growth Managers, developers, designers and decision-makers, it helps to:
- Defend a roadmap in front of stakeholders. When a stakeholder asks "why this test before that one?", the answer no longer relies on opinion but on transparent, reproducible scoring.
- Make implicit trade-offs visible. The Effort criterion immediately highlights the real cost of an idea, even before engaging the development teams.
- Create a culture of proof. By emphasizing Confidence, the method encourages teams to document their hypotheses with data rather than impressions, which improves the quality of the entire experimentation program.
- Stay strategically on course. Thanks to the Strategy criterion, the roadmap never becomes a mere race for the highest score: it stays connected to the company's real priorities.
At Welyft, we recalculate scores at every planning cycle, usually every 4 to 6 weeks. A score is never set in stone: as new insights come in (through a CRO audit or a Continuous Discovery approach), Confidence evolves, and so does priority. This continuous iteration is what makes it a true roadmap engine, not a one-off scoring exercise.
FAQ: your questions about the RICES method
What is the difference between the RICE method and the RICES method?
The classic RICE (Reach, Impact, Confidence, Effort) framework was popularized by growth teams to prioritize product features. At Welyft, we added a fifth criterion, Strategy, so that the CRO roadmap always stays aligned with current business priorities, not just the raw profitability of each test.
What scale should each criterion be rated on?
There is no universal scale: what matters is staying consistent from one test to another. At Welyft, we rate criteria from 1 to 9 and calculate the average.
Does the score replace expert judgment?
No, it structures it. The method doesn't eliminate the need for CRO expertise: it's precisely the team's experience that allows for accurate scoring, particularly on Impact and Confidence. The framework serves to objectify the discussion, not to replace it with an automatic calculation.
How often should scores be recalculated?
We recommend revisiting the scoring at each roadmap planning cycle, i.e. every 4 to 6 weeks. Every new insight, whether from a previous test, a user interview, or data analysis, can change an idea's Confidence and therefore its priority.
What tools should be used to manage scoring?
A simple spreadsheet is enough to get started: one row per idea, one column per criterion, and an automated formula for the final score. More mature teams integrate this scoring directly into their roadmap management tool (Notion, Airtable, Jira) to connect it with the entire CRO program.
The RICES method isn't a magic formula that decides for you. It's a tool for collective discipline, forcing every idea to prove its value across five dimensions before mobilizing your development resources. Used consistently, it transforms a CRO roadmap from a simple wish list into a true investment portfolio, prioritized according to the value it actually creates for your business.