

Launching an A/B test has a hidden cost that is often underestimated: traffic consumed, developer time, data analysis and opportunity cost. If you only measure the "success rate" of your tests, you're steering your strategy with a foggy rearview mirror.
At Welyft, we find that a company's maturity isn't measured by the number of tests launched, but by its ability to answer this question: "Does our experimentation program truly serve the company's strategic objectives?".
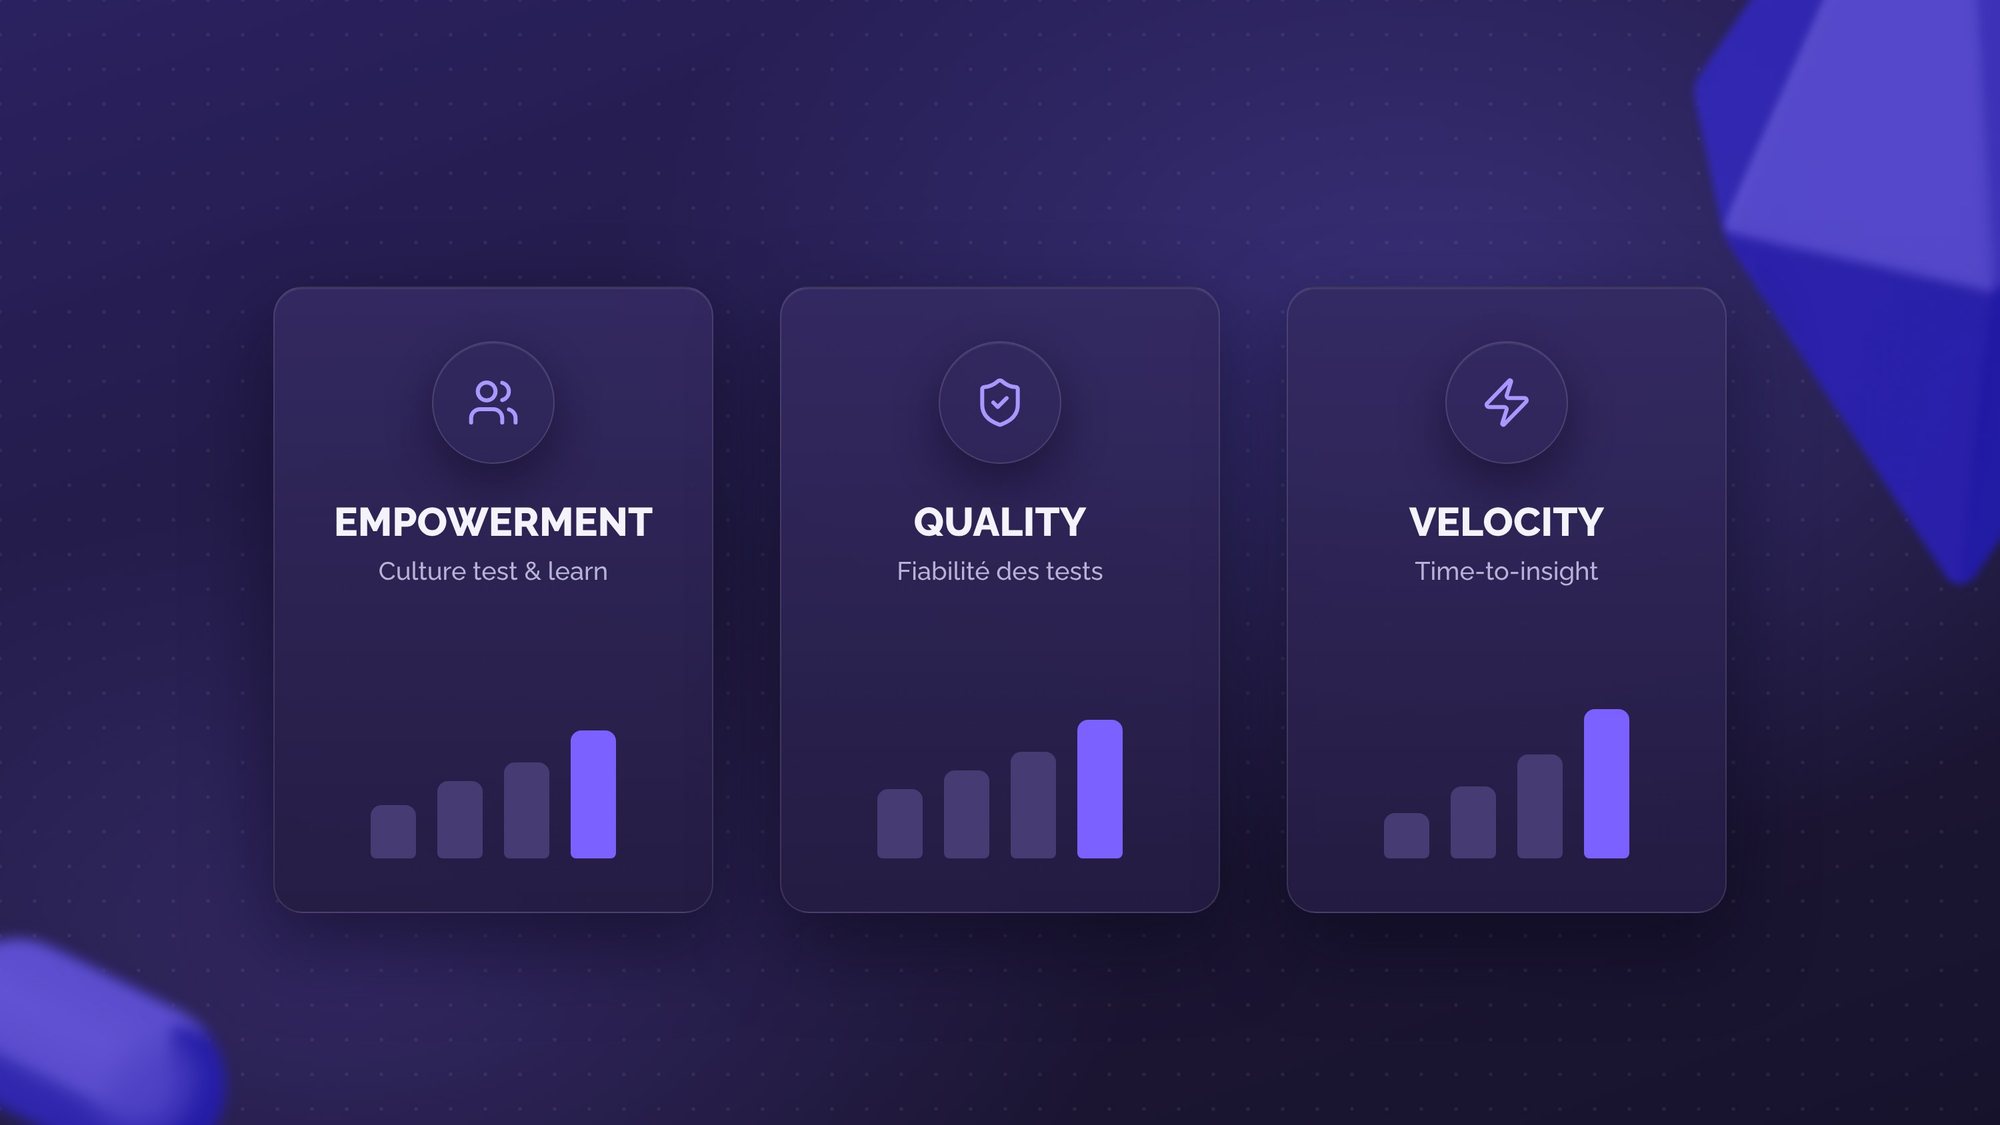
To move beyond flying blind, we've modeled a performance framework around 4 pillars: Empowerment, Quality, Velocity, Impact. Here's how to turn your testing roadmap into a sustainable growth engine.
Pillar 1: Empowerment — Spreading the "Test & Learn" culture 🚀
Experimentation shouldn't be the exclusive domain of an isolated team of experts. To scale, you need to democratize it.
Why is this crucial?
If only the CRO team proposes ideas, you create a bottleneck and a confirmation bias. Richness comes from diversity: a customer service agent or a Sales rep often has more relevant field insights than an isolated UX Designer.
KPIs to measure internal adoption:
- Active participation rate: Aim for 40% of accounts (Product, Marketing, Tech) logging into your A/B testing tool (AB Tasty, Kameleoon...) each month.
- Idea pipeline diversity: Track the number of hypotheses submitted by "Non-Product" teams (e.g., Customer Care, Logistics). A healthy pipeline should contain 20% external ideas.
- Training level: What percentage of your operational teams are trained in cognitive biases and results analysis? Aim for 90% to avoid misinterpretation errors.
Pillar 2: Quality — Reliability before speed 🛡️
"Garbage In, Garbage Out". A test based on false data is worse than no test at all, as it creates a false illusion of certainty.
Why is this crucial?
A single tracking bug or visible flickering is enough for Leadership to lose confidence in the CRO program. Technical rigor is the foundation of your credibility.
Technical health KPIs:
- Data integrity rate (SRM): Monitor the Sample Ratio Mismatch. If your traffic split isn't strictly 50/50 (or according to your configuration), the test is invalid. Aim for 95% of tests without an SRM alert.
- "Inconclusive" test rate: If more than 20% of your tests yield no result (neither winner nor loser) after 3 weeks, it's a sign of insufficient statistical power or too weak a hypothesis.
- Internal satisfaction (NPS): Survey Product Managers quarterly on the quality of CRO support. A score > 8/10 is necessary to maintain buy-in.
Pillar 3: Velocity — Reducing "Time-to-Insight" ⚡️
Agility is not optional. An idea tested 6 months after it emerges is often already obsolete.
Why is this crucial?
The cost of delay is real. Every day spent waiting for a test to be coded is a day of potential revenue lost. Velocity measures your ability to turn a business question into a quantified answer.
Cadence KPIs:
- Time-to-Live: The time elapsed between the validation of the hypothesis and the launch of the test. The goal is to get below 3 weeks.
- Time-to-Decision: Once the test is finished, how long does it take to analyze and communicate the decision? Aim for less than 2 weeks to avoid inertia.
- Backlog Health: Make sure you always have 50% of ideas with a "Ready for Dev" status so you never leave your developers without material if bandwidth frees up.
Pillar 4: Impact — Beyond the Theoretical Uplift 📈
This is the most complex pillar. Let's stop justifying CRO solely with theoretical ROI calculations (the famous cross-multiplication projected over 12 months).
Why is the classic calculation dangerous?
Projecting a +3% uplift observed over 2 weeks to a full year's scale is often wrong (seasonality, fatigue, novelty effect). Moreover, it ignores the immense value of "Losing Tests".
The real business value KPIs:
- Revenue Protected (Secured Gains): Financially value the losing tests. If you had deployed this feature without testing, how much would you have lost? This is a tangible value for the CFO.
- Industrialization Rate: What share of your winning variations is actually hard-coded on the site? Aim for > 90%. A winning test that isn't deployed is pure waste.
- Strategic Alignment (OKR): What share of your tests directly addresses the company's OKRs? (e.g., Increasing margin vs. Increasing volume). Aim for > 80%.
Take action with Welyft's CRO dashboard
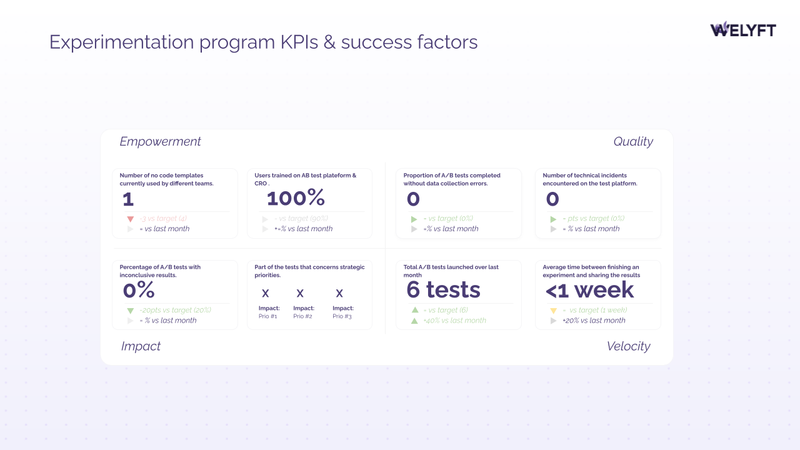
To manage these 4 pillars, forget scattered Excel files. You need a unified view. We recommend monthly reporting for operations and quarterly reporting for strategy.
Here is what the dashboard we deploy for our clients in CRO support looks like:
Structure to scale
Experimentation isn't magic, it's a discipline. By adopting these 4 pillars, you move from a tactical approach ("We're testing buttons") to a strategic approach ("We're securing growth").
Do you feel like your experimentation program has plateaued? Are you struggling to prove its ROI to your management?