


For any company, quantitative and qualitative data are crucial sources for gaining a deeper understanding of its customers and thus improving a product's experience in order to maximize its performance. With this in mind, experimentation leverages these two data sets to begin a CRO approach with two distinct research phases: quantitative analysis and qualitative analysis. Let's look together at their differences and how to make the most of them in your data marketing strategies.
What is quantitative and qualitative analysis?
Definition of quantitative analysis
Quantitative research, also called quantitative analysis, is a method based on facts and numerical data, often expressed in the form of statistics, in order to understand and analyze people's behavior. These results are analyzed in a table or graph following data collection.
In our CRO approach, we leverage our clients' first-party data from analytics tools such as Google Analytics 4 or Piano Analytics.
Example of quantitative analysis in CRO:
By analyzing the sales funnel on Google Analytics 4, we identify a specific quantified problem: 70% of users abandon their cart at step 3.
- The observation: We know where users leave and how many of them do so.
- The limitation: We don't yet know why they leave (is it the price? a bug? a form that's too long?).
Definition of qualitative analysis
Qualitative research relies on the interpretation of behavioral data. It is used to understand or explain an observed phenomenon.
This descriptive method is based on studies such as user interviews or observations like "heatmaps" or "session replays" that can be extracted from tools such as Contentsquare or Air360.
Example of qualitative analysis in CRO:
To understand the cart abandonment detected earlier, we use Contentsquare to watch Session Replays of the delivery step.
- The observation: We notice that users click several times on the "Confirm" button but the page doesn't load: a required field is poorly indicated.
- The insight: Qualitative analysis reveals the cause of the problem (an interface/UX flaw) that the numbers alone couldn't explain.
What are the differences between quantitative and qualitative analysis?
To optimize the user experience, it is crucial not to pit these two methods against each other, but to see them as two sides of the same coin. Here is a comparison table to make things clearer:
| Criterion | Quantitative analysis | Qualitative analysis |
|---|---|---|
| Objective | Identify leaks | Understand friction |
| Type of data | Numerical and statistical | Subjective, visual and descriptive |
| Key question | What? Where? How much? | Why? How? |
| Methods | Numerical data analysis | Surveys, interviews, verbatims |
| Tools | Google Analytics 4 or Piano Analytics | Contentsquare or Usertesting |
These two approaches, while distinct, represent a real opportunity when combined within a mixed-method approach.
Why combine quantitative and qualitative research?
Using a single research method in isolation does not fully answer the question at hand, as it lacks context.
Indeed, relying solely on quantitative or qualitative analysis is in itself a risk because:
- Quantitative alone: numerical results will not answer the question “Why?” or “How?”, in other words, understand the reasons.
- Qualitative alone: observations cannot be precisely evaluated. Moreover, without the quantitative side, qualitative analysis can lack direction.
Thus, adding a new layer of data to your analysis provides a broader view to facilitate understanding and formulate solid insights. Combining both methods helps fill the gaps of each individual approach.
3 examples of mixed methods
In UX research, several mixed methods, proposed by Creswell and Plano in their book “Designing and Conducting Mixed Methods Research”, exist, each suited to a specific use case.
Triangulation
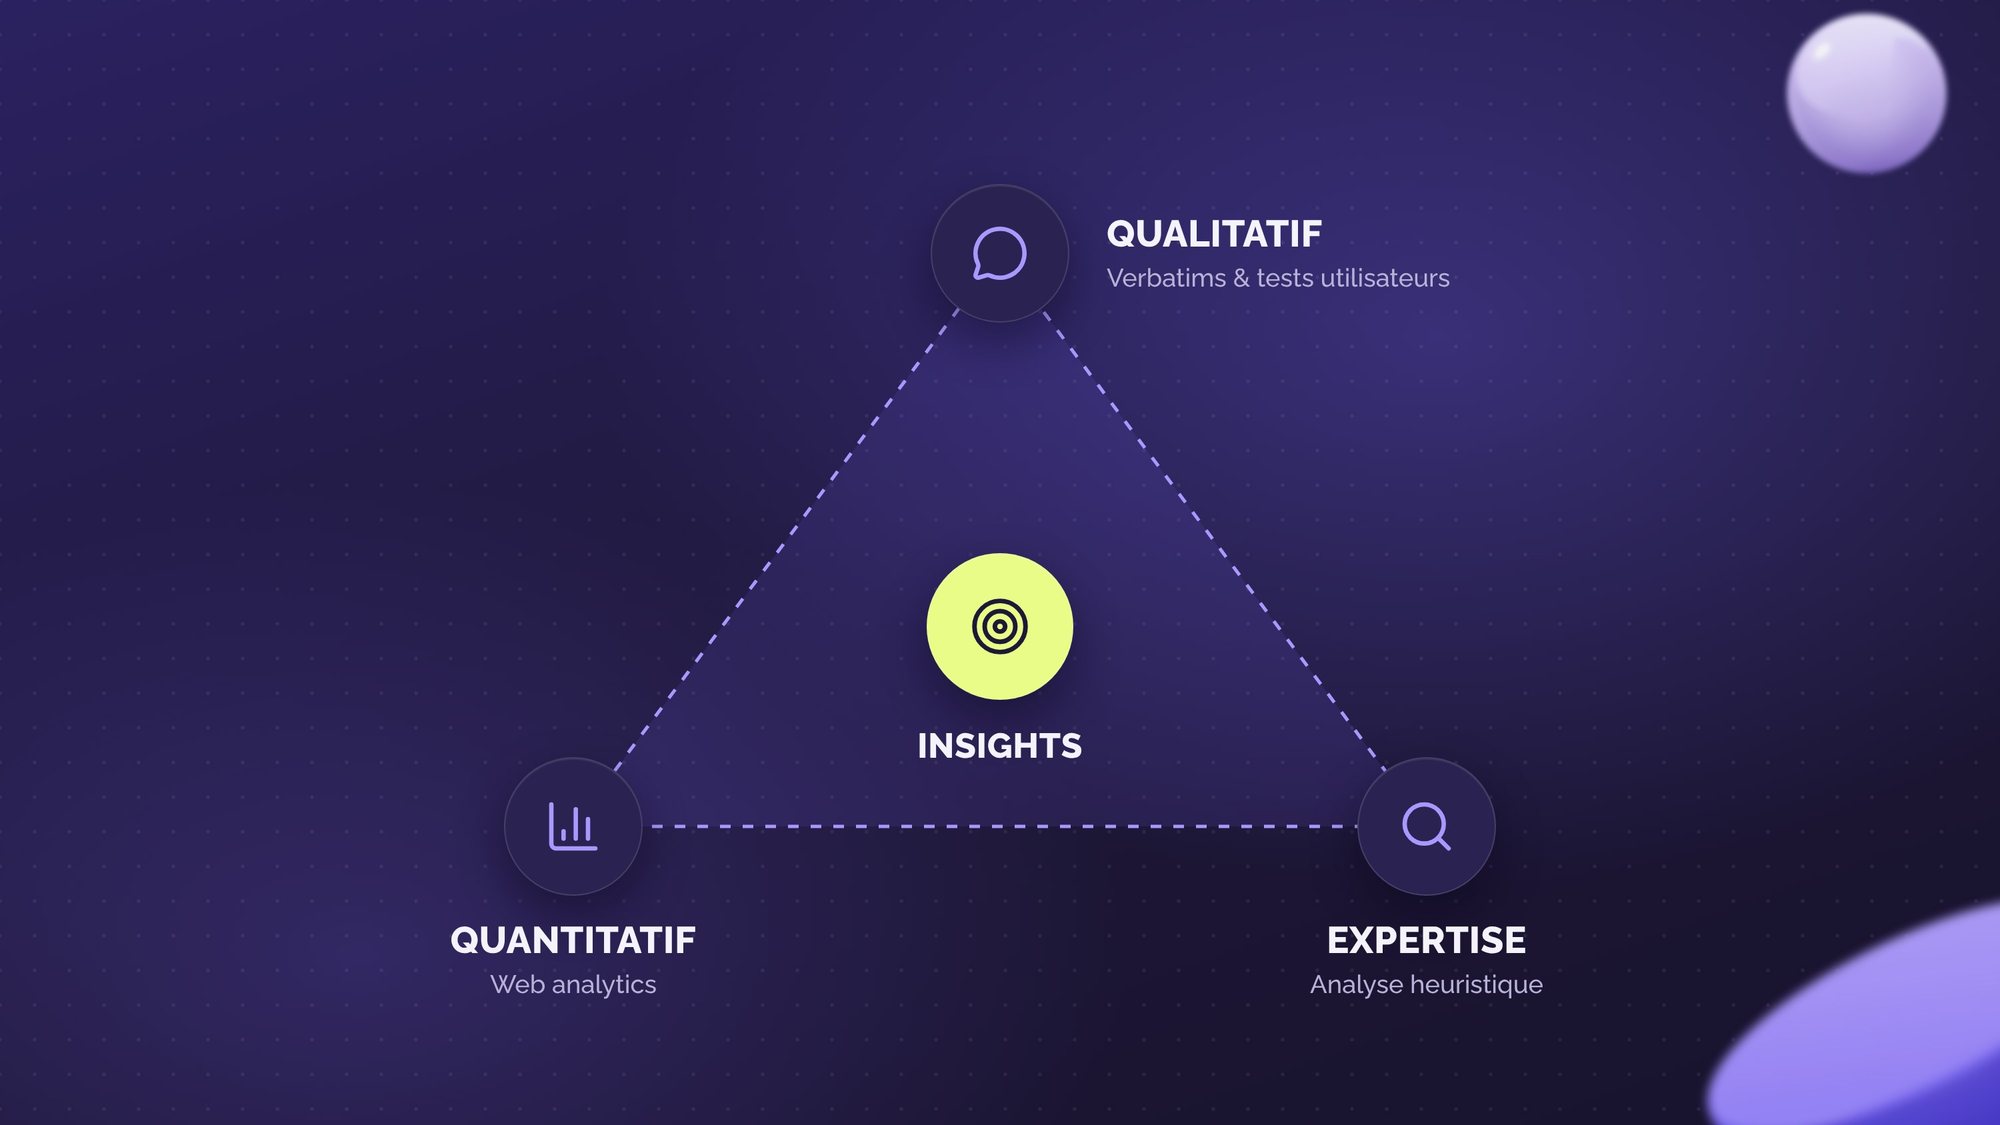
At Welyft, we use triangulation to transform raw data into a 360° view of your users. More than a simple verification, it is a tool for revealing deep insights.
The richness of this method lies in the diversity of perspectives it brings:
- Quantitative insight: through data analysis, we identify mass behaviors and statistical friction points.
- Qualitative insight: through session replay analysis, interviews or user tests, we understand emotions, deep motivations and experienced frustrations.
- Contextual insight: by observing the user in their real environment, we capture weak signals and unspoken usages.
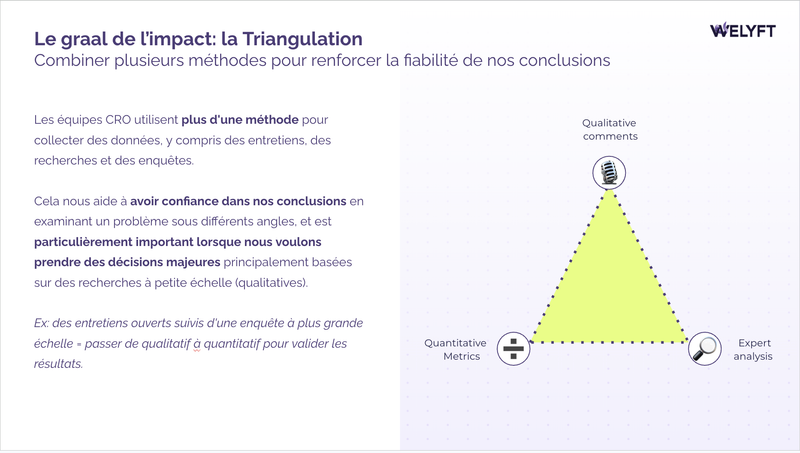
The rigor of triangulation should always remain proportional to the business risk of the optimization. For a minor change, a limited set of clues is enough to validate the intuition. However, as soon as the stakes impact the core of the experience or the business model, we multiply the data sources. The goal is to adjust the research effort to ensure secure decision-making without sacrificing the velocity needed for the project.
The exploratory model
This model unfolds in two successive stages.
It begins with an exploratory qualitative phase aimed at identifying hypotheses, pain points, or user needs that are still poorly understood, through interviews, user tests, or the analysis of verbatims.
These initial insights then serve as the basis for a quantitative phase whose role is to measure the scale of the observed phenomena and prioritize opportunities at scale.
This model is particularly relevant when the problem is poorly defined or when entering a new product or functional scope.
The explanatory model
As with the exploratory model, the explanatory model is divided into two stages, but in reverse, it starts with a quantitative analysis.
The qualitative analysis then begins in turn to explain the observed phenomena.
What if data alone weren't enough to decide?
Where is the line between qualitative and quantitative analysis?
In the practice of UX Research, the boundary between these two worlds is often blurred. That's where you get the best out of every piece of data. Here are four concrete examples where the quantitative and qualitative approaches come together for a complete analysis:
| Method | Quantitative | Qualitative |
|---|---|---|
| Comparative test (A/B) | The statistical preference rate for a variation. | The verbalizations that explain why one version won. |
| Card Sorting | The similarity matrix to see item groupings. | The labels users invent to name their groups. |
| 5-second test | The recall rate per visual element. | The overall impression spontaneously described in two sentences. |
| Verbatim cluster | The statistical weight of each theme identified. | Reading real reviews to grasp the nuance of emotion. |
By staying at this boundary, you no longer just measure behavior — you start to humanize it in order to make fairer decisions.
Which analysis method to choose in CRO?
In reality, pitting quantitative against qualitative is a false debate. To maximize the performance of a digital product, the question isn't about choosing one or the other, but about knowing how to make them work together.
At Welyft, we don't just accumulate numbers or list user frustrations. As part of our CRO audits, we systematically apply data triangulation:
- With quantitative data: we precisely identify where friction occurs in the funnel.
- With qualitative data: we decode the motivations and psychological blockers behind these behaviors.
This perspective makes it possible to prioritize the real conversion levers, avoid decisions based on an isolated signal, and formulate hypotheses that are actionable, measurable and robust.
The result for our clients? Recommendations that are no longer bets but investments. By making experiments more relevant, we turn the CRO approach into a predictable, sustainable growth engine.