


If you're a Data Analyst, Product Manager or Growth Marketer, you may have already experienced this situation: you launch a promising A/B test and wait weeks for results… which ultimately turn out to be non-significant. Or worse, you observe numbers that seem flat with one calculation method but suddenly become significant when switching statistical approach. Meanwhile, you're potentially losing valuable conversions, or letting an underperforming variant hurt your revenue.
Today, most A/B testing tools on the market (such as Kameleoon, AB Tasty, VWO or Optimizely) offer a Bayesian approach alongside the classic frequentist method, and some have even gone the other way, like AB Tasty, which was exclusively Bayesian before reintroducing frequentist statistics into its reports. But why these changes? At Welyft, as a CRO expert agency, we often notice that teams struggle to justify choosing one statistical method over another.
In this article, we won't overwhelm you with mathematical formulas. Our goal is to help you understand the mechanics of both methods so you can better choose the one that fits your context, your traffic and your business objectives.
What really differentiates the frequentist approach from the Bayesian approach?
To really understand what's at stake, you need to grasp the philosophy behind the two major statistical schools.
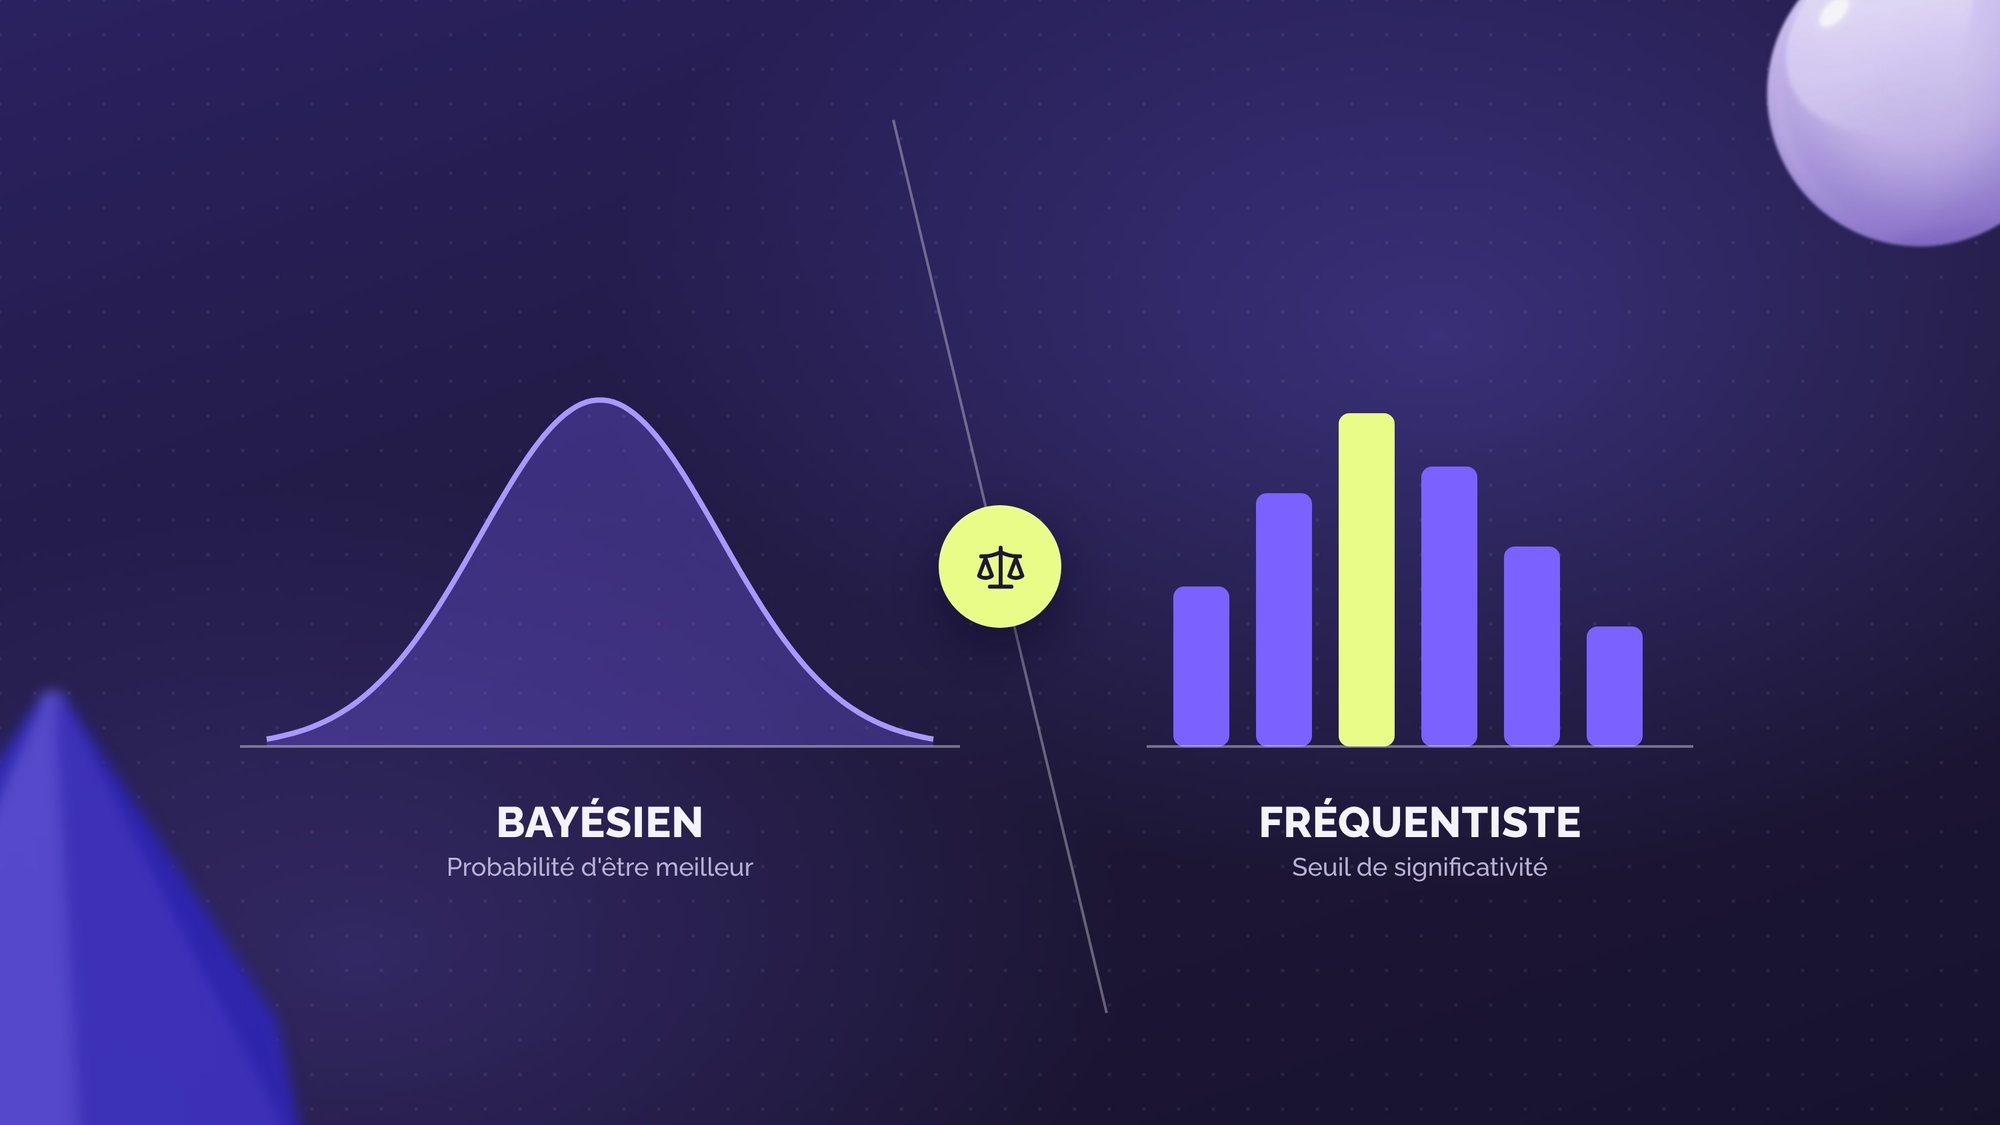
The "Frequentist" approach
The frequentist method is the traditional approach, the one taught in school. It gets its name from the concept of "frequency", where the probability of an event corresponds to the frequency at which it would occur if the experiment were repeated infinitely.
In an A/B test, you "think backwards". The method starts from a principle called the "null hypothesis". This means we assume there is absolutely no difference between version A (called "original" or "control") and version B (variant). The goal is then to accumulate a predefined volume of data to prove this hypothesis wrong, thereby demonstrating that the change made is statistically significant. No worries, this calculation isn't done by hand, there are many tools for that and we've listed the best calculators in this dedicated article.
Its key indicators are the p-value (which measures the probability that the observed difference is due to chance) and the confidence interval (which means that if you repeated this test many times, 90% of these intervals would contain the true gain). Ultimately, it's a binary method: either the observed difference is mere coincidence, or it's validated.
The courtroom analogy: It's like a trial. Version B is "innocent" of any superiority until you've accumulated enough evidence to prove otherwise.
The "Bayesian" approach
The Bayesian approach (from the theorem of British mathematician Thomas Bayes) works like a human making a decision. It incorporates existing knowledge and updates its probabilities in real time every time a new user interacts with your test. Rather than seeking to prove an absolute truth, this method gives you an intuitive, concrete answer: "What is the probability that variant B is better than A?"
Its key indicators are the probability to be best (expressed directly as a percentage chance that B beats A) and the credible interval (which tells you concretely: "there's a 90% chance your gain lies between +1% and +3%").
The sports betting analogy: Imagine you're betting on a tennis match. As the sets progress and players score points, you adjust your confidence about the eventual winner. You don't wait until the end of the match to understand who's dominating, you continuously update your "belief" based on what's happening on the court.
The two methods don't answer the same question. The frequentist approach seeks to determine whether a real difference exists between A and B, it's a question of existence. The Bayesian approach, on the other hand, directly indicates whether variant B is better than A and with what probability, it's a question of decision. It's often this nuance that teams miss, leading to misinterpretation of results.
What are the key indicators of the frequentist and Bayesian methods?
This is usually where things get complicated and technical jargon takes over. To put it simply, frequentist statistics and Bayesian statistics simply don't answer the same question.
Here's a clear comparison to understand concretely what you're reading:
| What you're trying to find out | Frequentist Method | Bayesian Method |
|---|---|---|
| The question the algorithm answers | "Is the observed difference between A and B due to chance?" | "What is the probability that variant B is better than A?" |
| The key success indicator |
The P-value Contrary to popular belief, this is not the probability of success, but the probability of obtaining results at least as extreme as those observed. It measures the weight of chance: the lower the P-value, the more the hypothesis of equality between A and B collapses in favor of a real difference. This is why it's often presented as "1 - P-value", turning an index into a more intuitive statistical confidence rate. |
The probability to be best In plain terms: It's direct and intuitive. The tool literally tells you: "There's a 95% chance your new product page converts better than the current one" |
| Estimating your potential gains |
The confidence interval Watch out for the trap! It doesn't give you the probability that your gain falls within this interval. It assesses long-term reliability. For example, a 90% confidence interval means that if you repeated this entire process (collecting data and calculating the interval) many times, 90% of these intervals would contain the true rate. |
The credible interval This is a direct and understandable estimate for your business. For example, a 90% credible interval means there's a 90% probability that the true gain falls within this interval. |
| The sampling rule |
Fixed size You must calculate the number of visitors required before launching the test and not touch anything until this figure is reached |
Flexible size the algorithm updates continuously with each new visit. You don't have a fixed sample size to respect beforehand |
| Observing along the way (Data peeking) |
Strictly forbidden Making a decision before the end of the test distorts the analysis and multiplies the risk of deploying a false winner |
Allowed You can monitor trends day by day. Ideal for instantly cutting a variant if it turns out to be harmful to your sales. |
Ultimately, frequentist vocabulary (such as the famous P-value) can be counterintuitive for anyone and often leads teams to misinterpret results. However, its rigidity has one merit: it leaves no room for interpretation. Below the set confidence threshold, the verdict is final, the test remains inconclusive, full stop.
This discipline even extends to the preparation phase. By calculating the test duration before launching it, you naturally structure your experimentation roadmap, avoid overlaps between tests on the same scope, and always know when you'll be able to launch the next one.
Conversely, Bayesian vocabulary aligns with the reality of our jobs: it quantifies a risk and estimates a financial gain, which greatly facilitates decision-making in meetings. However, this flexibility comes at a cost. No safeguard prevents you from declaring a variant the winner based on a still-fragile probability to be best. The risk is even more real for small effects, where the credible interval remains wide and takes time to stabilize, even when the probability to be best already seems promising.
Can you really read your results in real time?
The major flaw of the frequentist approach is its rigidity. If you look at your results along the way (what's called "Data Peeking") and make a decision before the sample threshold calculated beforehand is reached, you distort your analysis.
The Bayesian approach, on the other hand, can be a real decision-making accelerator, but this flexibility doesn't excuse haste. Before cutting a test, always make sure the observed trend is clear and confirmed over several days. A novelty effect, seasonality, or a simple one-off fluctuation can easily trigger a false alarm, especially when the credible interval is still unstable. Once these conditions are met, you can cut a test if it's causing your sales to drop, or deploy the winning version without waiting weeks due to a fixed sample size, as soon as you get a reassuring probability to be best with a tightened credible interval.
Which method for which context?
There's no "bad" method, only methods poorly applied to a given context. Here's how we recommend using them for your e-commerce or lead gen challenges.
When to use the Frequentist method?
It should be favored when you're working on major structural changes or high-risk tests where a wrong decision would be very costly. You'll need this "scientific rigor", which requires waiting until the end of the test to draw conclusions, in order to minimize risks as much as possible.
- Example 1: A complete checkout tunnel redesign. Imagine changing the design of every step in your checkout. If you get it wrong, the revenue loss will be massive. You'll therefore need the rigor of the frequentist method to be 100% sure of your statistical significance before putting your developers on a month-long project.
- Example 2: On very high-traffic sites, where the required sample is reached in just a few days. Here, the volume of data lets you benefit from the rigor of the frequentist model without suffering the usual waiting times, thus matching the responsiveness of the Bayesian method.
Recommended tool for the Frequentist method: The Welyft calculator
When to use the Bayesian method?
It's ideal for everyday agility and iterative tests. It allows you to stop earlier if a variant clearly outperforms, and to interpret results in a much more intuitive way.
- Example 1: On low-traffic pages (for example, B2B or niche markets). Here, getting the sample size required by the frequentist method would take 6 months. The Bayesian method lets you get a reliable probability to be best much faster.
- Example 2: On micro-optimizations (for example, wording, reassurance elements…). Because in this case, the implementation cost is low. If the credibility interval indicates a potential gain between +1% and +3%, you can iterate and deploy without waiting for absolute validation.
- Example 3: On short promotional campaigns (for example, sales, Black Friday…). Here, time is limited and the Bayesian method allows you to switch to the winning variant as soon as a strong trend emerges, thus maximizing immediate profit.
Recommended tool for the Bayesian method: The Welyft calculator
What is the real CRO expertise in all this?
Using the right tool at the right time, that's the real CRO expertise, but this flexibility of choice should not turn into methodological confusion. The method must be decided before the test launch, never along the way. Changing statistical approach midway through an experiment, or juggling between the two depending on which results suit you, seriously complicates the historization of your results and undermines the reliability of your conclusions.
Remember the essentials. The frequentist approach brings you rigor, ideal for high-stakes decisions. The Bayesian approach offers you agility, perfect for iterating quickly and deciding in real time. However, it is not suited to non-inferiority tests since it only indicates whether one variant is better than another, without being able to confirm that it is not significantly worse.
At Welyft, as CRO experts, we always choose the method that serves the results, not the one that's trendy. Because a good CRO decision is, above all, the right approach based on context, traffic, and business objectives.